
One of the most reliable and informative sources of mortality data over the past year has been the Institute and Faculty of Actuaries’ weekly mortality monitor report. It shows weekly and cumulative mortality for the year, and unlike the ONS, adjusts for population size and age so we get a truer reflection of how the current trends compare with the past.
Last week the report showed that the trend of deaths in 2021 has been so low since mid-March that all the excess deaths in January and February had been almost cancelled out and cumulative standardised mortality stood at just 1.1% above the 10-year average (see graph below).
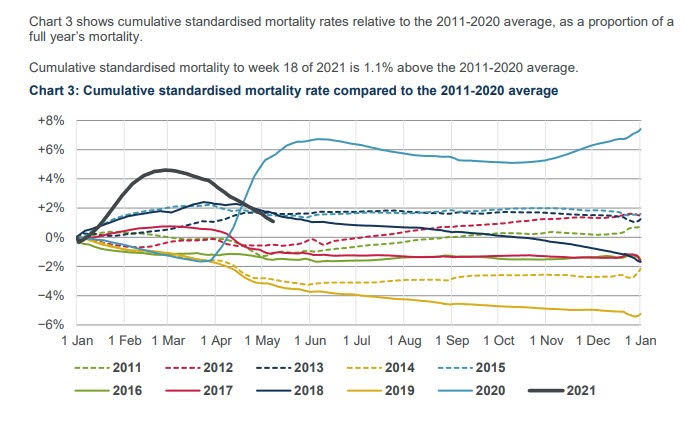
At Lockdown Sceptics we were waiting for the moment when, at some point in the next few weeks, this figure would hit 0% so we could announce that, despite the winter Covid surge, 2021 was now officially a low mortality year with below average age-standardised mortality.
However, it appears that moment now may never come, as unexpectedly this week the Institute changed the baseline on its key chart. The 10-year baseline is gone, and in its place is a straight comparison to 2019.
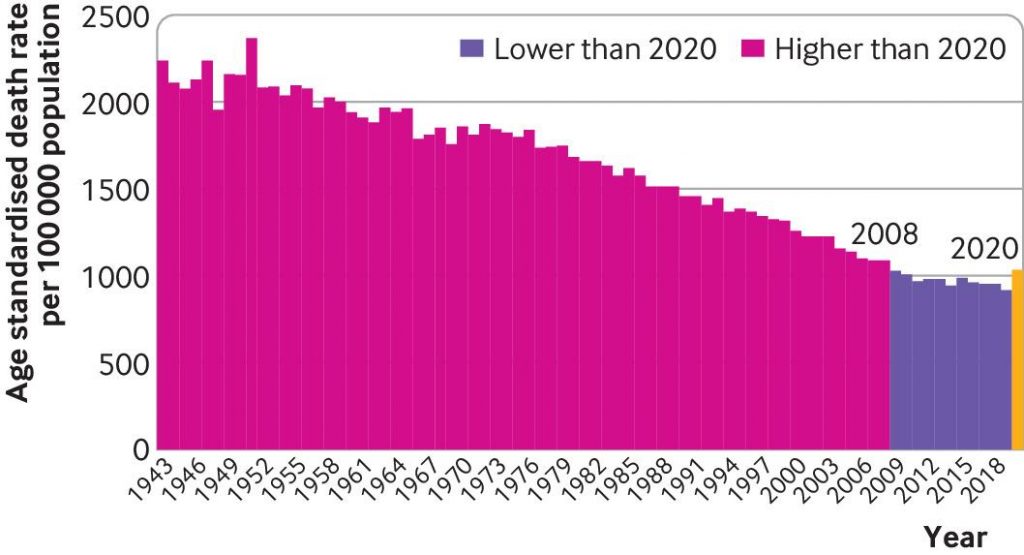
The important thing to know about 2019 is it is the year with the lowest age-standardised mortality ever (see below).
So now, rather than mortality in 2021 being around 1% above the 10-year average, it is suddenly “4.6% above 2019” (see graph below). The 10-year average line is gone completely so no comparison can be made with it at all.
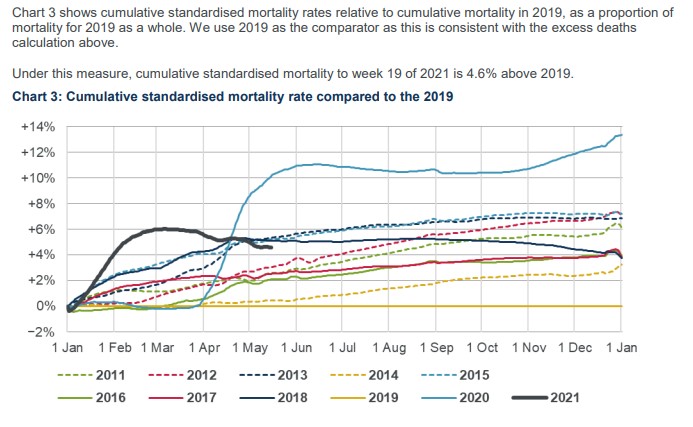
This major change in baseline – which is a big deal when producing statistics for keeping track of trends – is not acknowledged. A sign that the change may have been made without due care can perhaps be seen in the stray “the” left in the heading from when it was edited, so that in place of “compared to the 2011-2020 average” it reads “compared to the 2019”.
The only explanation we are given is: “We use 2019 as the comparator as this is consistent with the excess deaths calculation above.” It’s true that throughout the pandemic period the mortality monitor team have used 2019 for their excess deaths calculation, yet nonetheless they’ve used the 10-year average in the cumulative mortality chart. Why the sudden change? If they wanted now to show the cumulative trends relative to 2019, why not produce charts showing both?
It is frustrating that this change has been made just as their figures were poised to show 2021 heading into negative territory compared to the 10-year average. Even more frustrating is that the baseline is now the least deadly year in history.
They explain in previous reports that they use 2019 for their excess death calculation because they consider it to be the most accurate comparator for deaths “in the absence of a pandemic”, since “2019 and 2020 had similar mortality experience for weeks one to 12”. However, that doesn’t allow for the fact that 2019 was anomalously low even for recent years, not least because of a very mild winter flu season. It also doesn’t explain why they have suddenly changed the baseline in one of their key charts, making it impossible to continue keeping track of the trend against the last decade.
Lockdown Sceptics has contacted the Institute to query the reasons for the change and ask for the original baseline to be reinstated. I will update this post if we get a reply.
UPDATE: The Institute and Faculty of Actuaries (IFA) has responded to our enquiry and said: “The CMI [Continuous Mortality Investigation] has added the rationale for the change to Chart 3 to its website.” They add: “The CMI intends to continue to use the version of the chart relative to the 10-year average in its quarterly mortality monitors, the next of which is due on July 13th 2021.” So we’ll have to wait until mid-July to get an update against the 10-year average.
In their explanation they say:
We recently became aware that some commentators were treating the 10-year average as a benchmark for current mortality, or indeed the CMI’s implied view of what mortality rates would have been in 2020 and 2021 if the pandemic had not occurred. This is not the case. Age-standardised mortality rates tend to reduce over time, and mortality rates in 2020 and 2021 would very likely have been below the 10-year average in the absence of the pandemic.
This raises the question of why they were including the 10-year average at all if not as a kind of benchmark, and why they continue to use it in their quarterly reports if it is so misleading. Their rationale is also incorrect. Looking at the chart of age-standardised mortality above, it’s clear that while the rate declined until 2011, since then it has been largely flat, and 2019 was unusually low. This means the assumption that 2020 and 2021 would, in the absence of pandemic, have resumed decline, rather than potentially see an uptick following a mild year, has no basis. Furthermore, 2020 was obviously not the first year in history to see a pandemic, yet after previous pandemics age-standardised mortality continued its long term decline (despite not having vaccines). The mistaken assumption that pandemics are anomalous rather than part of the normal (if irregular) ebb and flow of annual morality – as though they should therefore be excluded from trends and baselines – is exactly the kind of historically blinkered thinking that got us into this mess. This change from the IFA only reinforces that erroneous strand of thinking.
Here’s their response in full:
This note describes the rationale for a change in the format of Chart 3 of the summary pandemic mortality monitor, with effect from week 19 of 2021.
Chart 3 of the week 19 monitor shows mortality rates compared to 2019. This is consistent with the calculation of excess deaths in the pandemic mortality monitor.
Previous versions of the pandemic mortality monitor, showed rates relative to an average of the previous 10 complete calendar years. This is consistent with the regular quarterly mortality monitors we have produced since Q4 of 2018.
We consider the choice of comparator in this chart to be relatively unimportant, as the aim of the chart is to allow comparisons between cumulative standardised mortality rates in different years. The use of relative rates makes that comparison easier. We have shown the current year and each of the last 10 years, compared against the average of those 10 years. This results in charts that allow the relative mortality for each year to be seen clearly.
We recently became aware that some commentators were treating the 10-year average as a benchmark for current mortality, or indeed the CMI’s implied view of what mortality rates would have been in 2020 and 2021 if the pandemic had not occurred. This is not the case. Age-standardised mortality rates tend to reduce over time, and mortality rates in 2020 and 2021 would very likely have been below the 10-year average in the absence of the pandemic. This is especially true for 2021, as the 10-year average includes the exceptional mortality since the second quarter of 2020.
As our pandemic monitors are aimed at users who wish to understand how mortality during the pandemic compares to what might otherwise have been expected, we are now showing how the current year and each recent year compares to 2019.
As we have noted since the start of the pandemic, mortality in the first 12 weeks of 2020 was similar to mortality in the first 12 weeks of 2019, so we regard mortality in 2019 as a better benchmark of “normal” mortality. Changing the format of Chart 3 means that it is now consistent with the calculation of excess deaths in the pandemic mortality monitor.
We intend to continue to use the version of the chart relative to the 10-year average in our quarterly mortality monitors, the next of which is due on July 13th 2021.


To join in with the discussion please make a donation to The Daily Sceptic.
Profanity and abuse will be removed and may lead to a permanent ban.
You’re being way too kind to them. They are enablers of oppression. You think they did this out of sincere and sudden conviction?
“The important thing to know about 2019 is it is the year with the lowest age-standardised mortality ever“
Looks like these guys have been learning from the Global Warming scarists. Get the right baseline and you can make normal look frightening.
Truth in science can’t come soon enough. The amount of lives that must be ruined by “scientists” deploying the tricks of base politicians!
Same old trick as ‘figures that appear to indicate a rise in the number of murders/unwanted pregnancies/road traffic accidents last year are misleading because the method of recording them has been changed since the previous report’.
Note the downward trend in the graph. All other things equal, surely 2020 would have continued the trend and therefore 2019 is a much better indicator of expected mortality than the 10-yr average. There is no conspiracy here, just a group of highly moral professionals providing their independent expertise.
So how to explain their failure to live up to these standards last year?
Rubbish. An average is required to account for anomalies such as good/bad flu seasons, cold winters, heat waves, etc. Picking a single data point will tell you nothing. It’s purely to hide information and not show it. To fit the narrative of an exceptional pandemic. The fact that this change has been made without any reference to it is also damning. I don’t know why they have done this (I don’t know if they are “highly moral” or “independent” just like you don’t) but it serves only to hide context and that is simply bad science.
“All other things equal, surely 2020 would have continued the trend”
No. Already the curve was trending up.
… and think about it – the course of continual decline in mortality would be a nonsense. It had to bottom out once many of the real causes of mortality in the sphere of public health had been eliminated.
The ‘imaginary curve’ of descent is essentially another example of faulty modelling – and we know where that landed us. It’s driving by looking out the back window – minus spectacles.
And while ONS numbers show 76,000 excess deaths in 2020 (over the previous 5 year average, it would appear that a maximum of 20,000 were deaths WITH Covid (3k+ at home, 7k- in care homes and a maximum 10k in hospitals since the ONS spreadsheet can’t tell us how many of them died WITH Covid). Forget 2021 till some annual figures are published. But of course by that time all this history will be corrupted for ever.
Brilliant piece Toby. But you are rather absolving Boris from blame for this nightmare!
Par for the course, continue fiddling the books.
Make the data fit the hypothesis … modern $cience!
They have been doing this for a while. On 12th January they published a news release with the headline: “CMI says 2020’s 13% rise in death rates worst since 1929”
https://www.actuaries.org.uk/news-and-insights/news/cmi-says-2020-s-13-rise-death-rates-worst-1929
Of course this was a direct comparison of 2020 with 2019.
ONS consistently compare weekly deaths with “5 year averages” that don’t correct for age profile or population growth. Obviously they are aware of the issue because they do produce age standardised mortality data monthly.
I can almost guarantee that some bright young graduate will have pointed out to management the relative ease of producing age standardised weekly reports and been told not to worry his or her pretty little head.
Routine overstatement of excess deaths is a propaganda tool.
🤣🤣🤣 pretty much is all I can say. Incredible! Luckily I do my own stats weekly based on the raw ONS data and have been tracking back to 2017.
Another hallmark of state socialism – an overmighty public sector pressurising institutions, in this case the actuaries, (described by themselves as the only profession more boring than accountancy, pooters one and all) into toeing ‘the party line’; enablers of state fascism.
We know where these leads. We have just seen another example at home with new restrictions imposed in areas without local consultation or any parliamentary scrutiny. Internationally, we have just seen it exemplified in Belarus.
Until we have the backbone, as a nation, to address our recent past, the bit that really affects our lives today, too much state in all aspects of our lives since 1939, we are destined to be locked down, in one form or another, forever.
Do stop making things up to suit your prejudices.
Actuarial calculations are an essential part of financial business – not a state service. There is a pressure to get things right rather than convenient.
Please refrain from replying unless you have a debating point to make. Vapourings are of no interest to anyone.
It is beyond obvious, after the last 12 months (Cummings parliamentary enquiry meanderings refer), that the public sector in this country is bloated, hopelessly inefficient and desperately in need of root and branch reform
You can bet that 2020 ‘s mortality figures will never be used in any baseline comparison mortality data. I mean, that would skew things, right? But of course it’s ok to use the unusually low mortality data for 2019 because that supports the narrative around how deadly covid has been and continues to be. These guys are masters at being selective and manipulative with statistical reporting. Like counting all deaths within 28 days of a positive covid test (regardless of symptoms) as covid deaths, but not one death, even within hours of a covid “vaccine” as a vaccine death. It’s so blatant but the dumbed down populace just go along with it.
Smoke and mirrors…
“Why has this Mortality Monitor Suddenly Changed its Baseline From the Ten-Year Average to 2019 – the Lowest Mortality Year Ever?”
Because they are part of a conspiracy to prolong coronamadness indefinitely.
There’s a couple of reasons I can reach for.. 1.) Covid started in 2017 and not 2019. But now that that narrative of the 2019 Wuhan lab leak is being peddled, they need to make the figures match. And we are now at the tail end of the pandemic so the deaths we are now seeing us as a result if something else entirely. 2.) The age standardised death rate is revealing more young people dying than normal at present and that’ll be the COVID vaccine and mental health problems. If this vaccine is the ticking time bomb people are suggesting, the actuarial task of working out if the insurance industry can withstand it is too vast. It’s incalculable. I mean there’s telling people compensation for vaccine injuries are capped at £120,000 and there’s actually capping it. The benefits structure in the U.K. can’t withstand the cost. For insurance driven countries, insurers can’t explicitly and blanketly exclude vaccine damage because then their paymasters in the Pharmaceutical companies will be left exposed to scrutiny their share price won’t survive. I wonder which way it’ll go? Will we have more of these sorts of anomalies as the narrative tries to pivot towards… Read more »
Oldest trick in the book: erase the past. They do exactly the same thing to prove ‘Climate Change’ agendas.
Contradictory to the low mortality rates is the theory that this completely normal seasonal virus was developed in a Wuhan lab for whatever reason, and it got out. The same people who think this notion is believable are usually the same people who scoff at the smoking gun being held by the WEF.
77th Brigade are undoubtedly working hard on this site.
It doesn’t follow from the premise that a virus was developed in a lab that it must have any great effect on seasonal mortality rates…
Caught red handed. Good work!
Is it possible to ‘reverse engineer’ the 10 year baseline from the data they have already published – allowing you to redo the graphs for 2021 to reveal the hidden data? Sounds like an excel job. Of course the resulting graphs wouldn’t have the imprimatur of the IFA, but still….
“they use 2019 for their excess death calculation because they consider it to be the most accurate comparator for deaths”
That is sheer bollocks, given the low level of mortality in that year.
Similarly, the ten-year average captures a period of unprecedented low mortality that is historical nonsense as a comparison. The bar chart is the most informative graphic.
Deeper investigation shows a recent general upturn in mortality from it’s minimum – especially if the interaction between years is captured by looking at two-year periods rather than annual figures.
Whatever – 2020 was no big deal, let alone 2021.
I’m surprised Johnson isin’t using that fact a lot more, the actual information is there
Change the definition of a Pandemic
Change the definition of herd-immunity
Change the definition of cause of death
Change the definition of what constitutes a vaccine….an so forth and so on…
Nope no surprises here at all
Good article, Will.
Hard to see how any objective analysis would compare to 2019. 2019 is the lowest January to April cumulative Age Standardised Mortality for England for any year for which data is readily available (back to 2001) and probably ever.
Here is an equivalent monthly cumulative chart for England based on the ONS monthly mortality data (the CMI actuaries data is based on England and Wales weekly data).
When we have the monthly data for May it looks like 2020 will be at around the 2011-2019 average. We are already down at almost identical year to date levels as 2015 and 2018.
Just for any actuaries out there, a reminder of your code.
The Actuaries’ Code
The Actuaries’ Code is the ethical Code of Conduct that all Members of the IFoA must adhere to. It came into force on 18 May 2019 (and
The Code has six principles.
Should have said
When we have the monthly data for May it looks like 2021 will be at around the 2011-2019 average. We are already down at almost identical year to date levels as 2015 and 2018.
It just wasn’t following the narrative so had to change.
Highlighting 2019 does indicate, for those who can be bothered, how much “dry tinder” was left after 2019 to feed things in Spring 2020.