
Estimates of the prevalence of long Covid – where symptoms persist for more than four or more than 12 weeks after infection, depending on the exact definition – vary dramatically.
Before getting to the estimates, what kind of symptoms are we talking about? All of the following have been reported: abdominal pain; cough; diarrhoea; fatigue; fever; headache; loss of taste; loss of smell; myalgia; nausea or vomiting; shortness of breath; and sore throat.
The ONS has documented that almost 14% of people who test positive for COVID-19 continue to report at least one symptom 12 weeks later. This estimate is based on data from the Coronavirus Infection Survey (CIS) – a large, random sample of UK residents living in private households. Here’s the ONS’s chart:
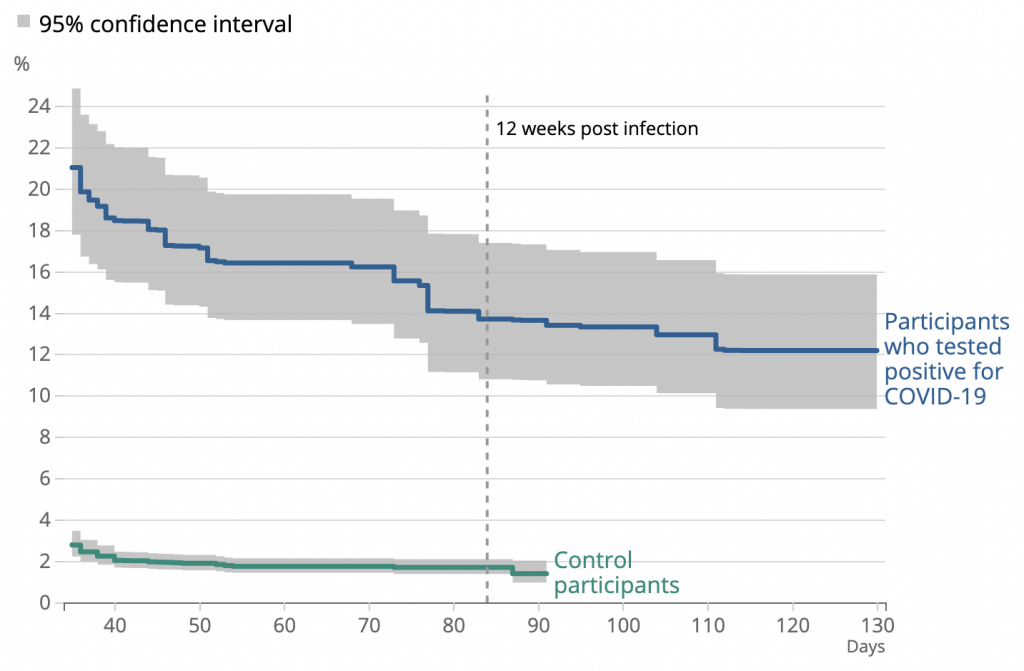
The control participants comprise individuals who took part in the CIS but were unlikely to have been infected. Note that only 2% reported at least one symptom on the relevant date. This seems to suggest that fully 12% of people who test positive for COVID-19 go on to experience long Covid (over and above the background rate).
However, while the CIS is a high-quality sample, the 12% figure isn’t necessarily correct. That’s because the symptoms are self-reported, and we don’t have any information on severity.
Due to the amount of media attention long Covid has received, CIS participants who tested positive might have been inclined to exaggerate their symptoms – to report things they normally wouldn’t have done. In other words, some of their symptoms might be more psychosomatic than physical.
By way of comparison, a study published in Nature Medicine in March of this year gave the percentage of people still reporting symptoms after 12 weeks as only 2.3%. This estimate is based on data from the Covid Symptom Study app, which asks participants to input their symptoms at regular intervals.
In a recent unpublished study, researchers analysed data from several longitudinal surveys, and found that the percentage of people still reporting symptoms after 12 weeks ranged from 7.8% to 17%, depending on the mean age of the sample (with older samples yielding higher estimates).
However, the authors of that study also estimated the prevalence of long Covid in the general population. They examined 1.2 million NHS patients’ electronic health records, and found that only 3,327 had been assigned a long Covid code, which amounts to just 0.3%. This suggests, the authors note, that “only a minority of people with long Covid seek care”.
In another recent study, researchers analysed an even larger sample of patients’ health records (comprising 58 million people) and found that only 23,273 – or 0.04% – had received a long Covid code. The outcome in this study was measured between February of 2020 and April of 2021.
In March of 2021, the ONS estimated the prevalence of long COVID as 1.1 million, or 1.7% of the UK population. This is is 41 times higher than 0.04%. According to the authors, the latter may reflect “under-coding, sub-optimal communication of clinical terms, under-diagnosis, a true low prevalence of long Covid diagnosed by clinicians, or a combination of factors”.
Given the possibility that some people’s long Covid symptoms are psychosomatic, the best way to estimate the condition’s prevalence is to ask people about their symptoms without revealing whether they’ve ever been infected. The true prevalence is then equal to the difference in frequency of symptoms between those who have and haven’t had the virus.
As Will Jones noted back in May, an unpublished German study used this method and found “no statistical difference” between those who were seropositive and those who were seronegative. One caveat is that their sample comprised students aged 14–17, so the results may not be generalisable to the adult population.
Interestingly, a new study based on Swiss data has reached a similar result: 4% of those who were seropositive reported symptoms after 12 weeks, compared to 2% of those who were seronegative – a difference of only 2 percentage points. However, the sample comprised students from primary and secondary school, so the same caveat applies as before.
Overall then, estimates for the prevalence of long Covid range from 0.04% to 1.7% of the population. And estimates of the chance of reporting symptoms after 12 weeks range from less than 1% to almost 12%. Given all the available evidence, I would suggest that those toward the low end are more plausible – especially if we’re talking about something of clinical significance.
This post has been updated.


To join in with the discussion please make a donation to The Daily Sceptic.
Profanity and abuse will be removed and may lead to a permanent ban.
Labour’s shadow health secretary Jonathan Ashworth seemed to be for permanent lockdown yesterday.
Today…
He says there is a need to be “cautious” but says it is right to “get our pubs and restaurants back as normal”. But as there are likely to be more people on public transport, people should wear masks, he says.
Seems like he’s read public opinion?
Well that was quick. He is pathetic
It’a hard to find politicians that aren’t – let alone pathetically illiterate in scientific reasoning.
Politicians always try & back both horses.
He’s such an arse, though not alone in so being.
he should have a fence tattooed on his arse
Or Klaus Schwab’s fence?
Or face?
What would these idiots be like in a war?
We are in a war! They’re the traitors.
Indded, policy or slieght of hand is implemented via analytics these days. All that social media and other data is thrown together to provide all governments and coporations the information they need to read the publics mind. They then use that against us.
Public opinion is irrelevant to the likes of Ashworth. Quite simply he has been given a revised script which is more in line with what the government want us to hear.
The current message is to “build hope and raise expectations” prior to a huge letdown owing to increased restrictions.
Ashworth is so thick he would fail the Green Cross Code test.
Nice summary. The idea that Long Covid necessitates that I offer my children up for the pharmaceutical experiment we are conducting is so ridiculously shallow those using it just seem to want to jab them for the sake of it.
The good thing about that German and Swiss study is that they did look at teenagers, who clearly have no worry from Long Covid, it’s indistinguishable from normal sniffles and other generalised feelings of illness.
AIUI Long Covid is pretty much the same thing as ME, which in the pre-Covid era was generally a result of someone having the bad luck of having dodged an endemic virus all the way through their childhood (when their immune system would be better equipped to adapt to it) only to catch it as an adult.
This implies Long Covid is of course a far greater worry on a society-wide scale than “traditional” ME (because no adults will have encountered Covid as children, because it’s a new virus) but it also implies that children (and perhaps teenagers to a lesser extent) aren’t really threatened by it themselves.
“ it’s a new virus”
Not in any substantial sense – otherwise the cross-immunity wouldn’t exist.
2020 = Novel
2021 = Variant
Guessing 2022 might be “Enhanced”
And as Dr Mike Yeadon has argued repeatedly and effectively.
I got glandular fever pretty badly as a teenager back in the 1980s and that morphed into ME. It took a few years to get things sorted completely, but that’s because it took me a while to find someone who addressed vitamin and mineral levels. High dose vitamin D helped significantly. There was talk that the BCG vaccination may have contributed to my problems.
I’m the same and I’ve had long covid too. It’s nothing like the aftermath of glandular fever. Or indeed a resurgence of GF, which being a herpes virus never fully retreats.
For me it was the tdap vaccine that set it off. Filled by loads of antibiotics
It is not pretty much the same as ME. Do you even know what ME is? It’s not even called ME any longer. No-one knows whether CFS is a post viral syndrome. But for a CFS diagnolsis to be made there has to be an unusual and prolonged period of exhaustion following activity or exercise – the so-called post-exertional malaise. For some CFS patients the condition might be the eventual exhaustion that arises from the CNS malfunction or disregulation of untreated ADHD – there appears to be a relationship in a subset of patients. Another condition you armchair doctors might want to discuss i.e. whether in your amazingly educated opinions ADHD exists or not. You can induce ADHD in mice where the mother was made to consume nicotine during labour. That malfunction can persist into further generations.
Unlike long covid, ME is a serious illness that many people never recover from.
I’d be more worried about long-covid vaccine syndrome.
The Covid jab has been well tested and it will do what it’s supposed to do, that’s the nub of the probem.
Na. Stop lying to yourself.
On long-covid – I’ve had colds that I’ve found hard to shift. It’s not whether a symptom exists but its severity. Anything that ignores severity is not worth even reading. If people have to go back to their GP (minus the 95% who will be malingerers) then I’d accept that. I suspect its no more than long-cold or long-flu or long-sprained-ankle. It’s just what the covid fanatics talk about when there are no deaths
Well said, Steve.
…and it’s what people talk about when there is nothing else going on in life for them to talk and think about! If everything returned to proper normal I’m sure ‘long covid’ would quickly be forgotten about.
the long-covid clinics will get about as much use as the nightingale emergency hospitals
At least the Nightingale hospitals were eventually mostly usefully repurposed as vaccination centres.
Oh, very fuckin helpful.
Long Covid is the result of a fcuked up immune system. A “vaccine” will only fcuk things up further, but that’s what it’s supposed to do.
just see how the summer wave predictions are coming along
My bet would be that most long COVID is psychosomatic. After a year and a half long fear campaign, how could the hypochondriacs fail to come out in force?
I don’t doubt Long COVID is real. But no one need fear the virus or its manifestations. Only because numerous agents known to treat it in early stages continue to be suppressed, does fear persist.
Let us not forget the terrible diet, widespread obesity, sedentary lifestyle, general flabbiness and infantile beliefs of the general population.
In case of a real war with an external enemy we as a nation would be defeated in 3 days.
I’ve got long covid – Day 470…
‘Fatigue’…
lol! I’ve had long-covid symptoms since the first day I got a paper round 38 years ago!
You need a G7 barbecue to perk you up!
If long Covid was that prevalent where are the thirty odd clinics they promised back in September to build specifically to help ‘sufferers’? I suppose Serco and the rest have had the money and nothing has been delivered.
The base assumption clearly has to be that this new respiratory virus is similar to all the others, in causing longer term post-viral effects in a very small percentage of unfortunates, and the large numbers sometimes reported are just an effect of the societal mass hysteria about covid.
Such prevalence of psychosomatic or falsely claimed illness among hysterics is pretty much inevitable with something as grossly exaggerated and constantly reinforced in the media as covid, and is surely made more likely by the huge disruption caused by the panic over-reaction.
Going to take a lot of evidence to credibly shake that assumption, and that’s going to be particularly problematic given the loss of credibility in the authorities, both governmental and scientific, both of which have been repeatedly caught out lying or suppressing evidence in the attempt to spread fear about this virus.
This is my take as well. It’s not uncommon to be impacted long-term by an especially bad bout of flu, for instance.
I wonder how much of this whole thing is down to mass hysteria and hypochondriacs? I’m sure I read, some months ago, an account from a nurse, who stated that a lot of so called cases turning up were people with nothing more than a cold. They had so worked themselves up that they thought they were dying, yet, the nurse said, the medics were forced to take them seriously.
Add to that people who get tested ” just in case”…..I have a work colleague who had a really bad stomach bug, but trotted off for a covid test “just in case”. Turned out he had campylobacter, and the covid test was negative.
“I wonder how much of this whole thing is down to mass hysteria and hypochondriacs?“
A huge amount, undoubtedly.
Hypochondria is a well known feature of human nature. As is mass hysteria. When a society obsesses 24/7 about a particular disease, you will get cases of that disease even if it’s entirely made up. That’s only going to be exacerbated by the massive fear propaganda, the direct involvement of the authorities and the hugely intrusive and all-pervading social disruption inherent in the panic over-reaction to covid.
The “Cotton” variant
In a normal world we’d call them infantile, bedwetting morons.
Remembering:
“Experience has shown that communities faced with epidemics or other adverse events respond best and with the least anxiety when the normal social functioning of the community is least disrupted.”
shouldn’t we just be referring to “long covid” as Lockdown Fever, or Lockdown Anxiety Syndrome, or something similar?
The probably very few genuine post-viral cases would need to be identified over time.
Common as muck
““But I think we have got to be careful about using the language of irreversibility, because we still have 350,000 new infections every day across the world, there is still room for the vaccine-busting variants that we are all worried about.” – Jeremey Hunt
early contender for the day’s ‘Order of the Yellow Mattress’ (shamelessley stolen from here)
I think a real world difference (between vaccinated and unvaccinated) of about 1% is unlikely to be significant.
I hope for the irreversibility of justice heading inexorably towards those who knowingly lied, exaggerated, engaged the behavioural psychologists, profited, ignored the medicines that might have helped, seeded the carehomes with death, denied care for every other condition, destroyed the economy and downplayed and ignored the damage being done by the experimental gene therapy.
That’s the irreversibility I want to see.
Hunt seemed to side step all that responsibility very well, but is still bleating from the touch line about variants and no doubt wants the children jabbed.
Be worried about investigations and the righteous anger of the bereaved and broke.
Or of the desire to tuck money under the mattress?
He’s always been a first class HUNT.
I have got long hay fever. In my younger days I had severe longer hay fever. I want state compensation for all my suffering whilst my fellow citizens did not have to stay at home because of my suffering.
So, if you came out of hospital, and you’d tested positive for ‘Covo’ whilst in there. But also had a large piece of cancerous material removed from your body, and, let’s say one had high blood pressure – with a couple of other ongoing ailments. You would surely need time to recover, no? I wonder, would this be classed as: long covid or perhaps; long bollocks [of the utter variety] ??
Bollox, my dear chap.
long COVID hahahaha. My word they have the public wrapped ’round their fingers
I am sure some instances of “long COVID” are genuine. After all, we have known that post-viral syndromes have existed for a long time. I remember last year when “long COVID” was first mentioned, looking into the extent of post-viral illness at the time and found a study that said that around 300,000 people in the UK suffered from it at any one time. But I also wonder to what extent “long COVID” is simply a consequence of the entire nation’s mental and physical health declining following 15 months of being stuck at home, for the most part, getting much less exercise, eating and drinking more, being outside less, and wearing unhygienic masks while working or shopping. I know that despite my best efforts to get exercise every day, the simple fact that I don’t have to commute into an office or walk around it all day and that I spend most of my day sitting down in front of a computer, has meant that my physical fitness has declined significantly. Is “long COVID” actually just the symptoms of government-imposed “long lockdown”? (that’s before we even think about the psychological effect of the wall to wall fear porn in the… Read more »
“some instances of “long COVID” are genuine”
Undoubtedly – with emphasis on the ‘some’. Post-viral syndromes are not uncommon.
After I had Covid in March last year – I didn’t need hospital, very nasty flu like though, knocked out for about two weeks – it took about three months to get my energy levels back up. Which you’d expect in my late Sixties age group. The sense of smell came back a bit in that period, it seems to be returning more strongly now. My lungs feel a bit less than happy.
I don’t call any of that Long Covid though.
It’s normal recovery time.
However, there could be long term consequences to come of past infection by a chimera pathogen. I might call that Long Covid.
If you had Covid in March 2020, the recovery time seems a bit longer than normal to me.
My wife has (had? – recent scans are clear) metastatic colon cancer which spread to her lungs. She had months of gruelling chemotherapy both before and after surgery to remove part of her right lung. She was 63 at the time.
Six months later she was jiving like a teenager at a friends wedding.
It’s a downward spiral. The less exercise you do, the more lethargic you become. That run to the train/bus in the morning, is a major part of some peoples exercise regime.
As anybody who has suffered a myocardial infarction will know the legacy effects, both physical and mental, can last over twelve months. MI’s are prevelant and I know many who have suffered, to date none make a fuss and bleat about their bad luck, they just try to carry on with life.
Maybe I should start a trend – Long M I.
Well – at least this time, Noah has noticed the flaw in the study – the self-reporting, and consequent element of hypochondria and associative thinking in the sample.
Watching GB News has quickly become just as frustrating as watching the wretched BBC (OK, maybe not quite so bad). The male presenter they have in place of Brazier is nauseating in his pro-lockdown stance. Previously I always welcomed a variety of opinion on debate, but lockdown has never welcomed opinion outside what SAGE deem correct.
Their narrative has gone unchallenged for 17 months, we don’t need to listen to some privileged berk telling us we should still wear a mask after the fake freedom day. But it’s GB News’ promotion of the ‘vaccine’ that is deeply concerning. They certainly seem to be complying with WEF’s new psychological assault, as is documented here:
https://www.lifesitenews.com/news/world-economic-forum-proposes-psychological-plan-to-overcome-vaccine-hesitancy
The WEF calling for “more assertive approaches against ‘vaccine misinformation’….ie, the truth.
Mustn’t forget the new powers given to OFCOM by the dictatorship.
All totalitarian systems love and abundantly practice censorship, ours is no different.
“Psychosomatic” is just code language for “we don’t know the cause and I – as person who’s not affected – am convinced it doesn’t exist and/ or isn’t important”. Not that long ago, gastric ulcers were also considered “psychosomatic”, IOW, being convinced that other people’s ailments must either have been made up or are at least not something they should be worrying about is pretty typical human behaviour. That’s one of the reasons why I never see a doctor unless it really can’t be helped: I know the talk already.
NB: In 2019, I had to go through some weird “prove that you actually exist” procedure when “my GP” was outsourced to Virgin health as I hadn’t been there since 2014 and someone suspected something must have been fraudulent about that.
There doesn’t seem to be a good way to deal with these people: When you need them, they tell you it’s really nothing and that you should go away again. If you then stay away, they make you come to undergo some useless procedures :-).
“Psychosomatic” is just code language for “we don’t know the cause and I – as person who’s not affected – am convinced it doesn’t exist and/ or isn’t important”.
pretty sure that’s fibromyalgia too
“Due to the amount of media attention long Covid has received, CIS participants who tested positive might have been inclined to exaggerate their symptoms – to report things they normally wouldn’t have done. In other words, some of their symptoms might be more psychosomatic than physical.”
…….or even about having more time off work at taxpayer expense.
Aka – post viral fatigue syndrome
Why no mention of the even more dangerous Long Flu?
https://time.com/5915616/long-flu-1918-pandemic/
Funnily enough Ivermectin has been found to almost completely eliminate Post Viral Syndrome, but that is one of those inconvenient facts.
Who cares?
It’s all bollox.
In January last year I had a persistent cough, temperature and fatigue. The cough lasted about 6 weeks. For the following four months I was short of breath, had an irratic heartbeat,inability to concentrate and was tired all the time. Saw a cardiac consultant who was talking about fitting a pacemaker. Luckily in July it all cleared up and I’ve been fine since.
I never had a test but feel pretty sure I had Sarscov2 with post viral issues. Had a negative antibody test in August, but I reckon a T cell test or similar would confirm.
I know loads of people who had a similar experience to mine around the same time, sadly they’ve all gone on to have the vaccination.
Pretty much the same her. It’s still not completely over but grown a lot less bad. I still fondly remember the first day without tinnitus after months of it.
However, almost 6 months of almost complete social isolation and still being prohibited from meeting with my parent (living in Germany) certainly didn’t improve anything.
My friend, who is close to 70 yrs and not in the best of health, had fairly bad covid (was not hospitalised) in March 2020. By March 2021 her “long covid symptoms had finally abated. Then she had the vaccine and her “long covid” was back to square one. She has told her GP that he must write it in her notes that she is to have no more Covid jabs.
It seems that older people are reporting more symptoms.
Older people generally have more aches and pains.
Older people also tend to have poorer memories.
Just saying.
PS I am an older person. My health has been better in the last few months since I had my jabs. Or maybe it was the vitamin D. Who knows?
Long Co-vid = post viral fatigue/ hay fever/ a cold. But don’t let the facts get in the way of a great story.
ANY study that includes the words ‘Tested positive for Covid 19’ and uses data from the test is complete and utter pointless bollocks end of…….hence I haven’t wasted any of my time reading this!!
All illnesses are now covid illnesses. MS, ME.. the beginning stages of Parkinsons.. the fatigue from rheumatism or cancer..
It is all covid and long-covid now. It is the only thing that makes us ill and we die from now in 2021. Makes it easier for the NHS.
Cancer startring to grow unnoticed = long covid. Beginnings of MS or ALS = long covid. CFS (ME) = long covid. Natural death = covid. Suicide = covid. Run over by a car = covid.